LiDAR is a prominent technology that has been fundamental in supporting various North Dakota Geological Survey (NDGS) missions.
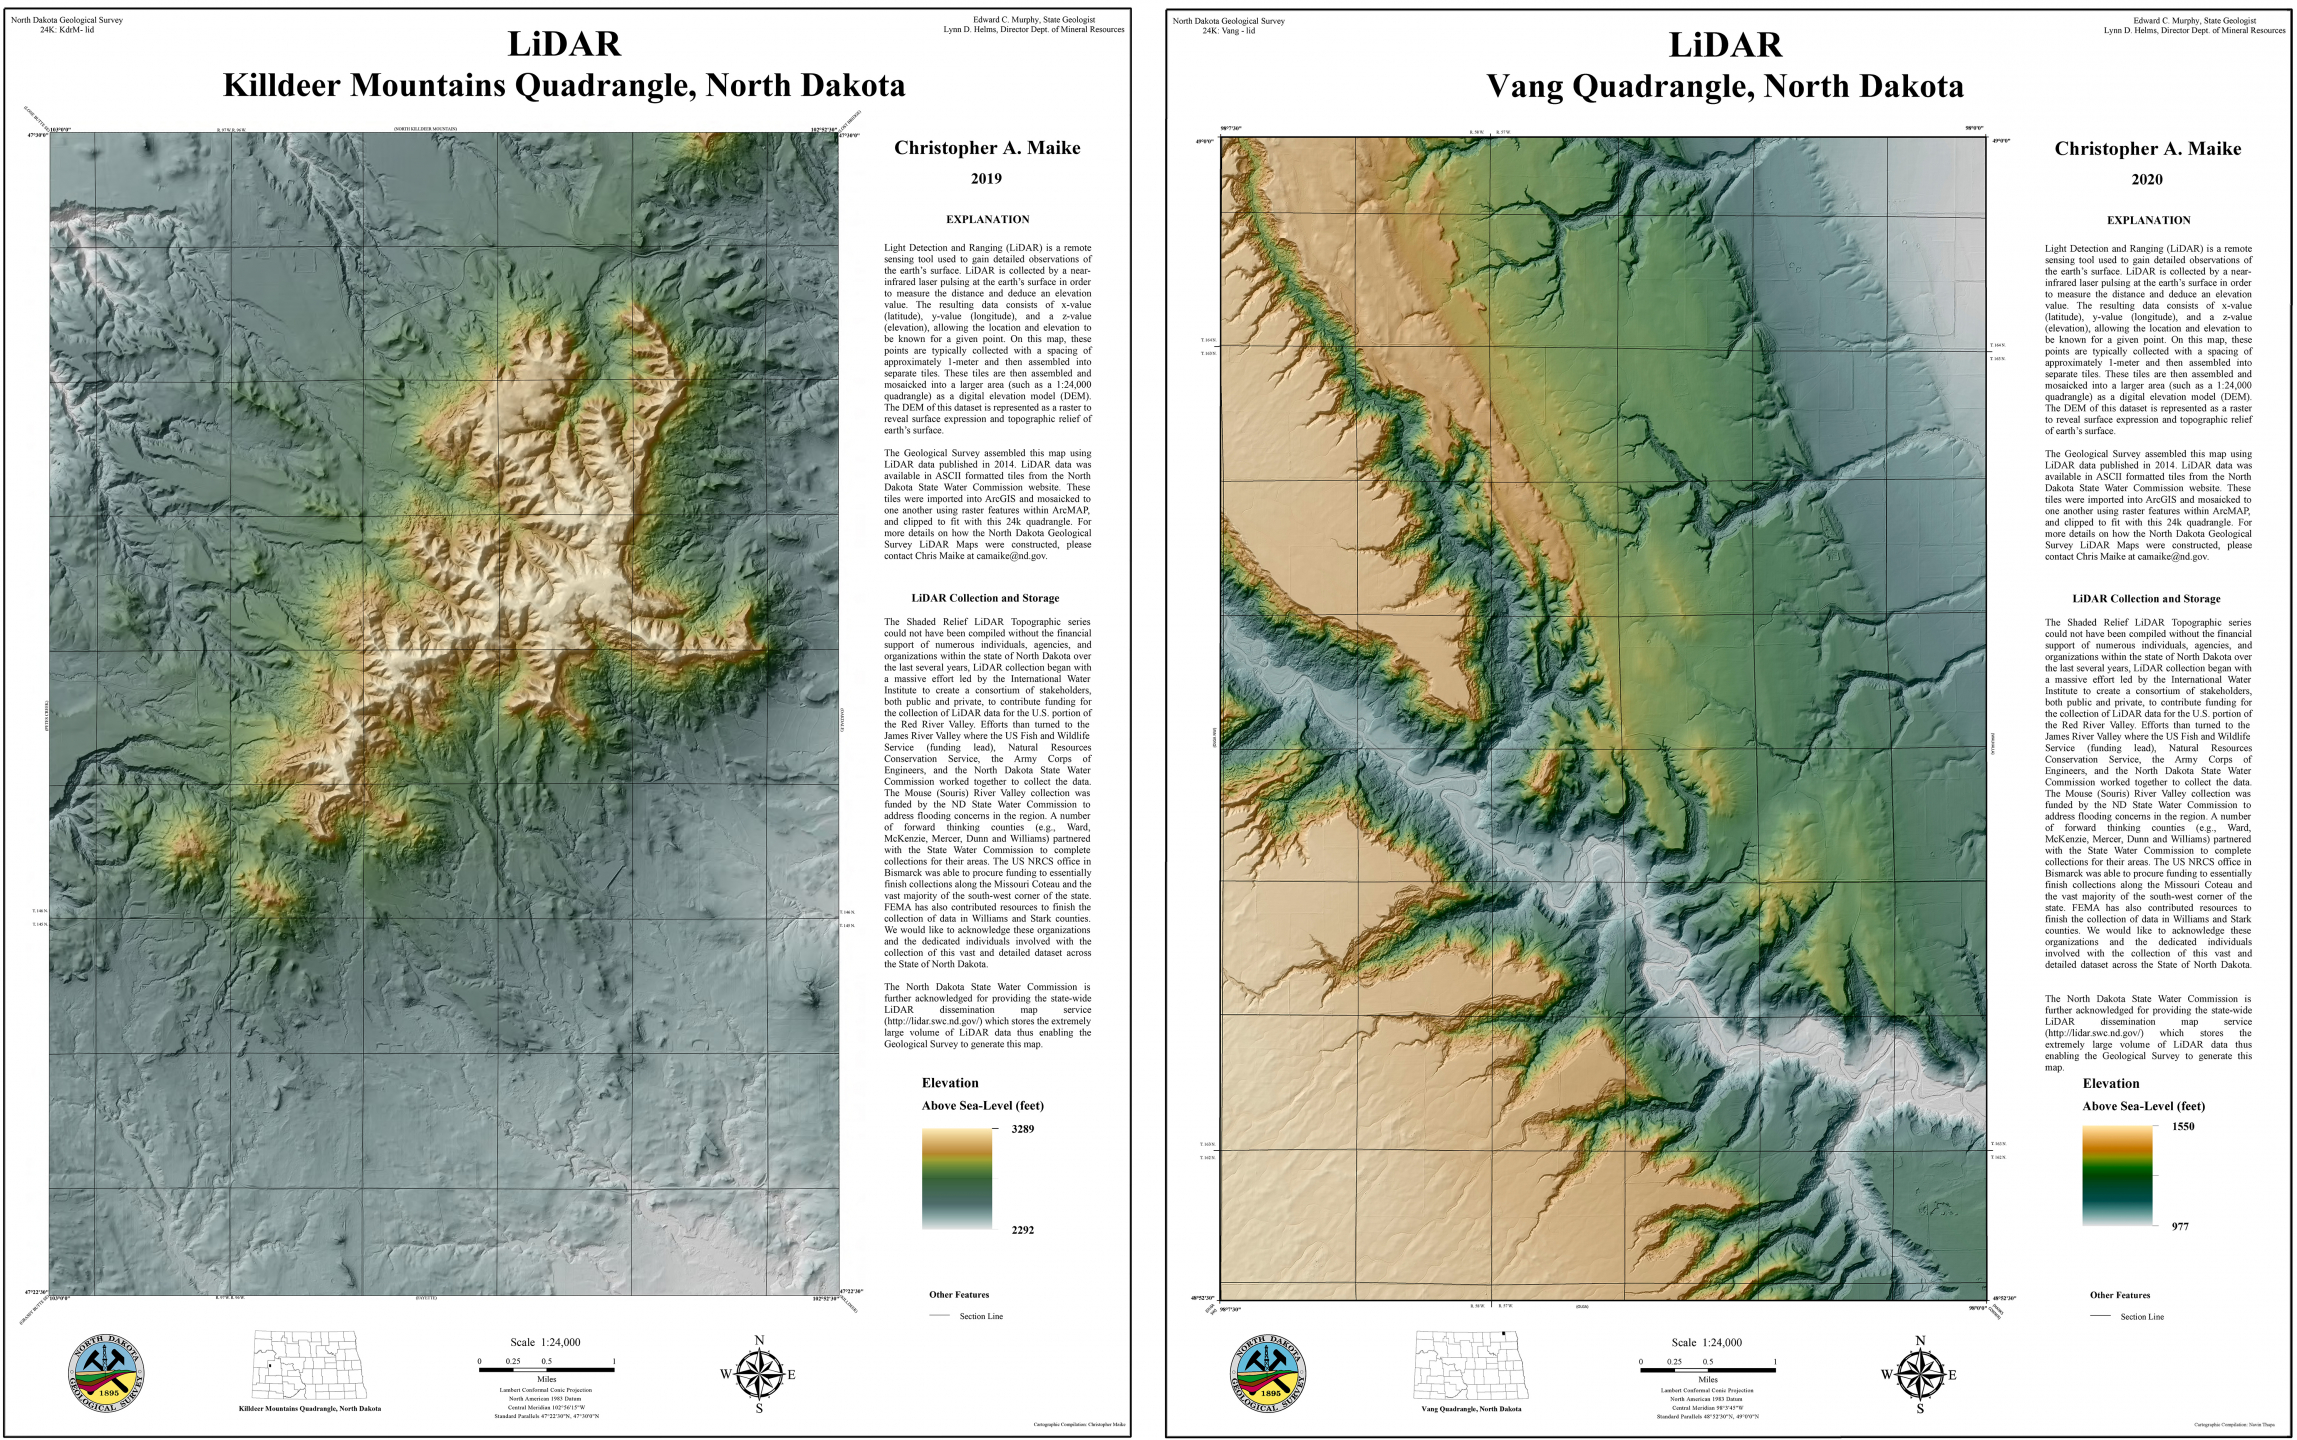
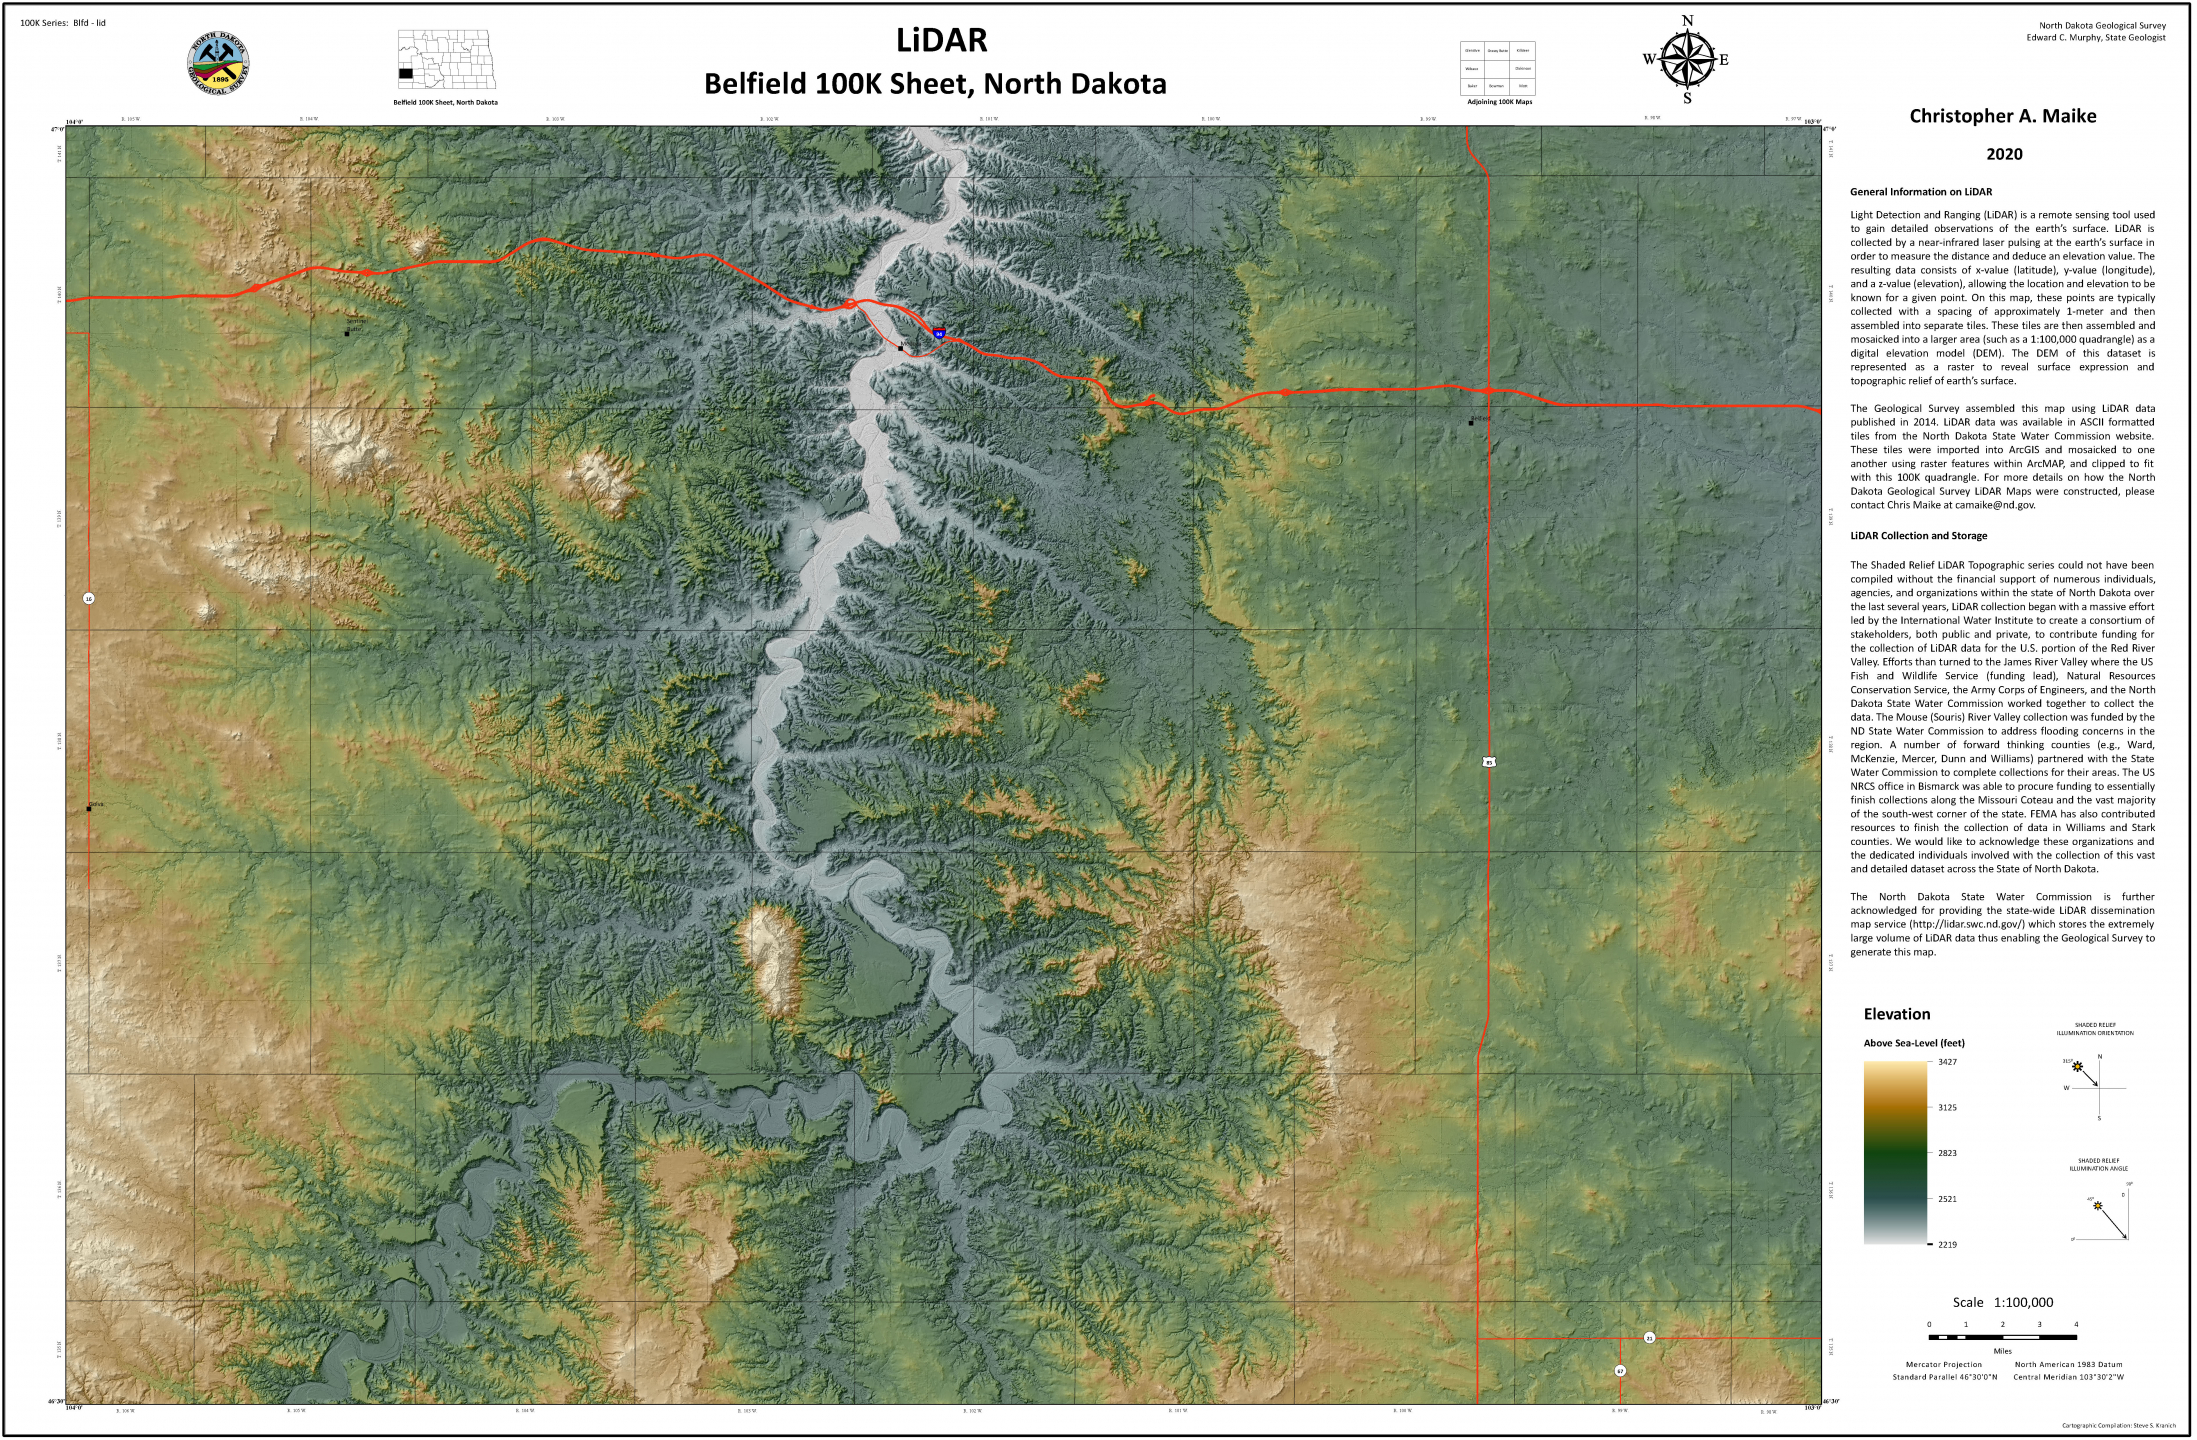
Light Detection and Ranging (LiDAR) is a remote sensing tool used by geoscientists, geographers, and engineers to gain detailed observations of the earth’s surface. LiDAR is collected by a near-infrared laser pulsing at the earth’s surface to measure the distance and deduce an elevation value. The resulting data consists of x-value (latitude), y-value (longitude), and z-value (elevation), allowing the location and elevation to be known for a given point.
Geologic maps further the scientific understanding of North Dakota geology and provide an added economic value for the knowledge of natural resources. The application of LiDAR can be used in a variety of industries. Geologists have many uses, including high-resolution topographic mapping, geological landform identification, watershed delineation, geologic hazard mapping, paleontological dig surveying, urban planning, evaluation of potential sand and gravel deposits, wind and cellular tower placement, glacier volume and modeling, flood and erosion modeling, earthquake damage surveying, volume calculation in mining activities and countless others.
LiDAR is collected over large areas to create a three-dimensional image of the Earth’s surface. A plane or drone is equipped with a laser system, GPS equipment, and software. Planes are used for larger missions, such as covering a county or larger area, whereas a drone is a more cost-efficient method for smaller LiDAR collections, such as a well-pad or, at most, hundreds of acres. To briefly explain this technology, a plane carrying high-precision GPS equipment flies at low altitude, and light waves from the LiDAR are emitted to the surface and travel back to the sensor. The time it takes the light to travel is known as the two-way travel time. From this, a precise X, Y, Z (latitude, longitude, elevation) grid of millions of points is acquired for a dataset. This type of grid is known as a three-dimensional point cloud. For North Dakota, on average, the point clouds typically have an average horizontal spacing of approximately one meter between points. From this dense array of points, the elevation between them can be interpolated as pixels, resulting in a model of Earth’s surface known as a DEM (Digital Elevation Model). The software can filter out trees, vegetation, buildings, etc., also known as "noise", which results in a smooth “bare-earth” model.
The NDGS saw an incredible amount of potential in the data and launched the LiDAR 1:24,000 (24K) and 1:100,000 (100K) map series in early 2016. The NDGS wanted this data to become more visual and accessible to the general public. The final product of the 24K and 100k map series includes a DEM, hill shade, and a pdf. The DEM and hillshade are of greater use for power users such as geologists or GIS technicians, whereas the PDFs are intended for more general use. These maps provide landowners, developers, planners, students, teachers, and other users valuable insight into understanding Earth’s surface of North Dakota.
LiDAR has been a cornerstone in the NDGS hazard mapping program. The intersection of geology, lasers, and a window of a few years has provided an entirely new dataset with which NDGS geologists can characterize the state’s most hazardous slopes.
Before any building foundation or road base is constructed on any grade, before any fiber optic, electric, oil, gas, water, or sewer line can be laid, engineers must first consider slope stability. Despite its reputation as a relatively flat plains state, even North Dakota’s more gentle slopes are often comprised of weak, clay-rich sediments that cause costly impacts to infrastructure where they fail. The NDGS documents the settings in which these slope failures have occurred across the state through its landslide mapping program. Recent Geo News articles have documented the progress of the program, including the dramatic advances in landslide identification via LiDAR (Light Detection and Ranging) and digital aerial photography over the nearly 20 years NDGS geologists have been mapping them. To date, the NDGS maintains an inventory of over 66,000 slope failures within North Dakota, a number that will continue to grow as older maps are updated using the latest digital imagery.
The availability of two LiDAR datasets, collected years apart, gives insight into land displacement that occurred during this window of time. Geologists map while referencing multiple years of aerial photographs and hillshade models to avoid mapping non-landslide features common on slopes. Snowdrifts, logjams, ponding water, human earthwork, and stream erosion (which can undermine a slope but is not mapped in isolation) all produce changes that appear on the differential elevation raster, often in between or overprinting signal from actual landslides.
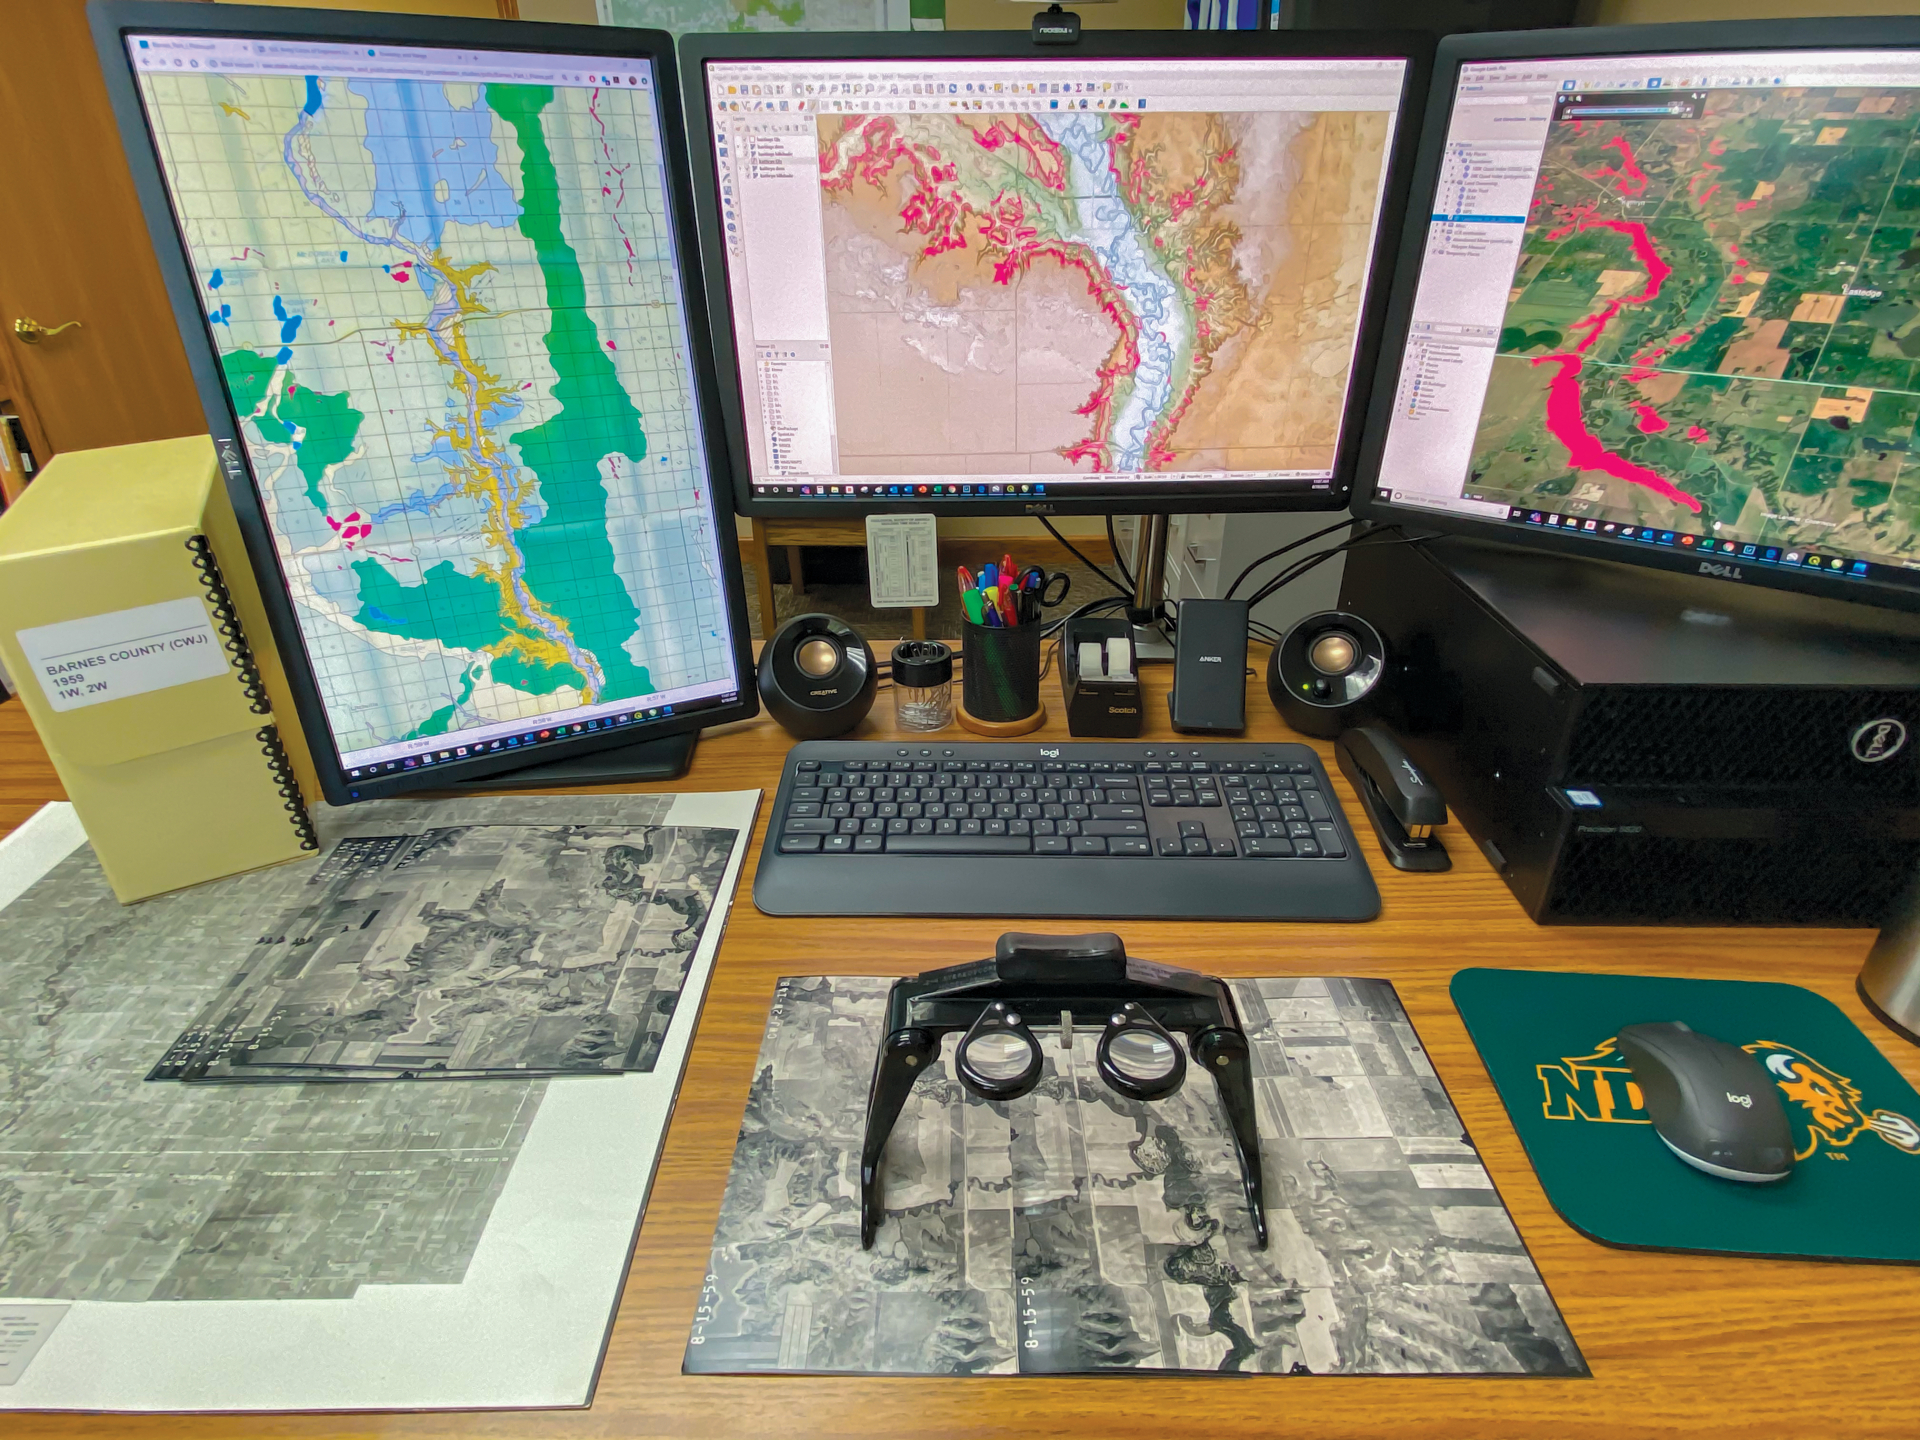
Phase II landslide mapping along the Sheyenne River Valley using 1:20,000-scale 1959 aerial photographs viewed through a stereoscope (bottom), a Barnes County surface geology map (left screen), LiDAR DEM (center screen), and aerial imagery on Google Earth (right screen).
The primary sources of funding to collect the LiDAR data within the state of North Dakota are at the Federal, State, and County levels, such as the US Fish and Wildlife Service, Natural Resources Conservation Service, Federal Emergency Management Agency, US Army Corps of Engineers, North Dakota Department of Water Resources, McKenzie County, and the International Water Institute. The stewardship of this data is handled by the North Dakota Department of Water Resources and can be found at https://lidar.swc.nd.gov.
The NDGS is committed to keeping up with technological changes and integrating them as part of its regulatory programs and mapping endeavors.
Identifying Active Landslides - Repeat LiDAR coverages allow remote sensing of slope movement
Landslides Through Time - Active and Dormant Landslides in Eastern North Dakota
- ND in 3D - Structure from Motion
- A Bird’s Eye View: Drones Offer New Perspective for State Agencies
- Drone Applications at the NDGS
- Drones Rising from the Prairie: Geological Applications of Unmanned Aerial Systems
- Surface Mapping of Sand & Gravel and LiDAR Applications
- LiDAR: What is it and how do we use it?
For any questions regarding the NDGS LiDAR series or geologic hazard mapping, please contact Chris Maike or call (701)-328-8000.