
Regional Geological Setting
The Red River Formation is a late Ordovician carbonate—evaporite sequence deposited in the Williston Basin covering North Dakota, South Dakota, Montana, Saskatchewan, and Manitoba (Fig. 1) with maximum thickness of ~700 ft in the central part of the basin (Carroll, 1979).
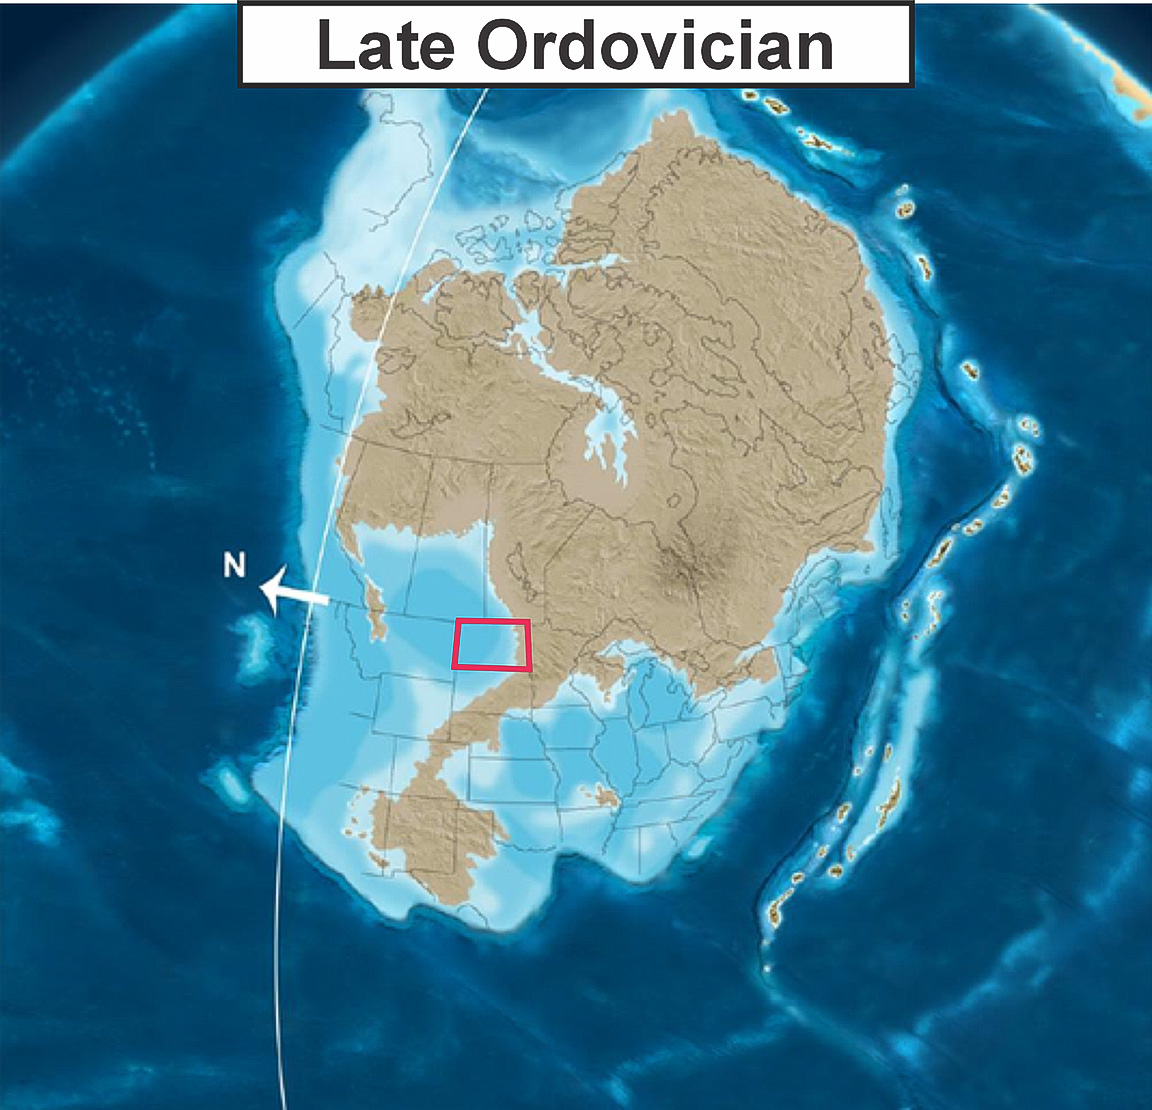
Figure 1. Paleogeographic map during Late Ordovician in present-day North America. Red outline showing present-day North Dakota outline (modified from Blakey, 2013).
Stratigraphically, the Red River Formation unconformably to gradationally overlying the silty mudstone of Roughlock Formation (Paterson, 1971; Porter and Fuller, 1959) and conformably underlies the calcareous shale of Ordovician Stony Mountain Formation (Carroll, 1979) (Fig. 2).
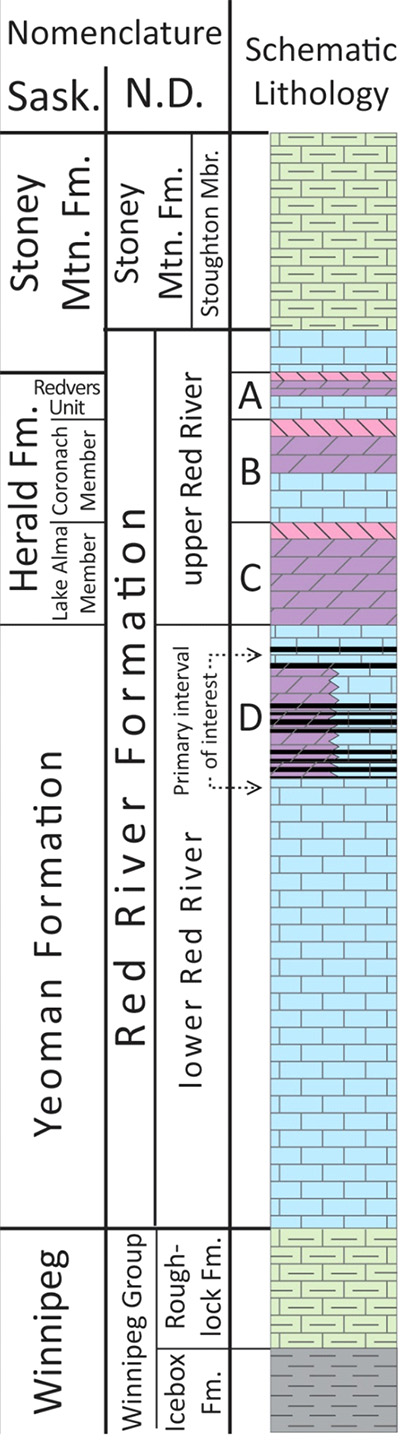
Figure 2. Stratigraphic column of the Late Ordovician in the Williston Basin, comparing nomenclature from Saskatchewan (Kendall, 1976) and North Dakota (Murphy et al., 2009). Mbr. = member; Mtn. = mountain. (modified from Nesheim, 2017).
The Red River Formation is informally divided into the lower and upper Red River based on lithologic characteristics and cycles (Porter and Fuller ,1959; Sinclair, 1959; Fuller, 1961; Ballard, 1963), equivalent to the Yeoman, Herald, and lower parts of the Stony Mountain Formations within Saskatchewan (Kendall, 1976) (Fig. 2)
The lower Red River comprises the D interval, which accounts for approximately two-thirds of the entire formation. The lower part of this interval consists predominantly of non-porous burrow-mottled lime mudstone to wackestone (Fig. 3A), while the upper part transition into porous, partly to completely dolomitized burrow-mottled limestone (Fig. 3B) (Carroll, 1979).
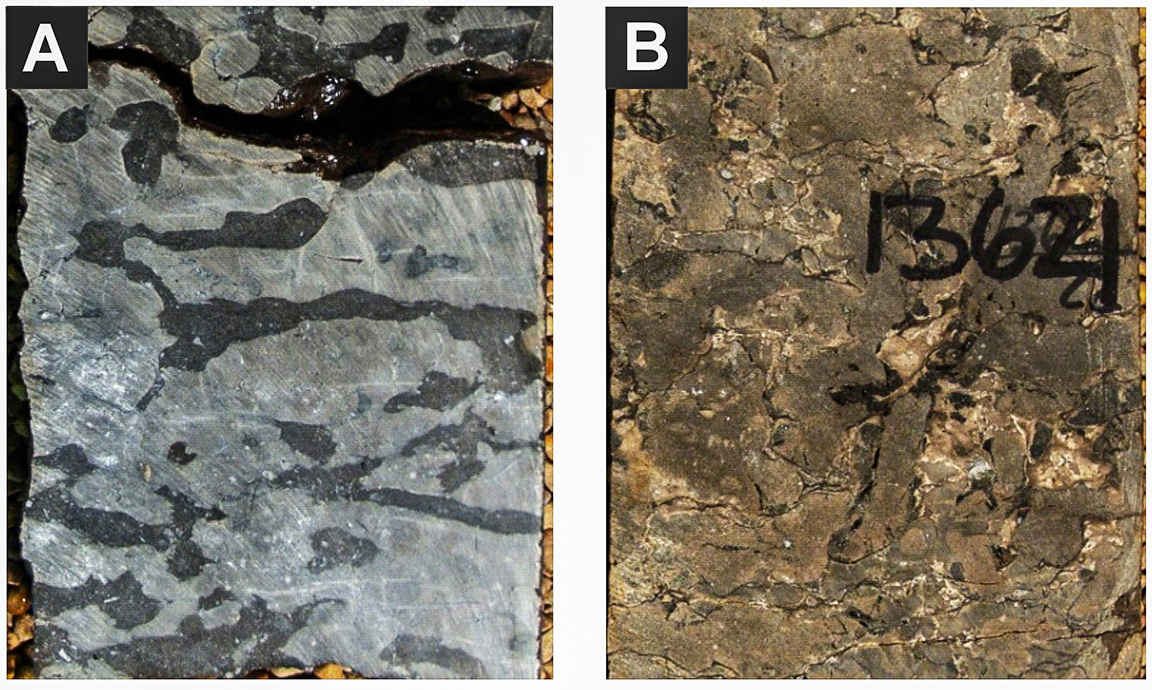
Figure 3. Example of core photographs from the Red River D interval: (A) non-porous burrow-mottled limestone, and (B) porous, burrow-mottled dolomite (modified from Nesheim, 2017).
The upper Red River comprises of C, B, and A intervals in ascending order and consists of three cyclic transgressive-regressive sequences (Husinec, 2016). Each sequence is characterized by three distinct facies associations: (1) skeletal mud- to packstone with abundant burrows at the base, displaying subtidal deposits of transgressive and early Highstand System Tracts (HST) (Fig. 4A, B); (2) porous laminated dolostone represents peritidal deposits of the late HST (Fig. 4C, D); and (3) subaqueous anhydrites at the top, represents evaporite Lowstand Systems Tracts (LST) during sea-level fall (Fig. 4E, F) (Husinec, 2016).
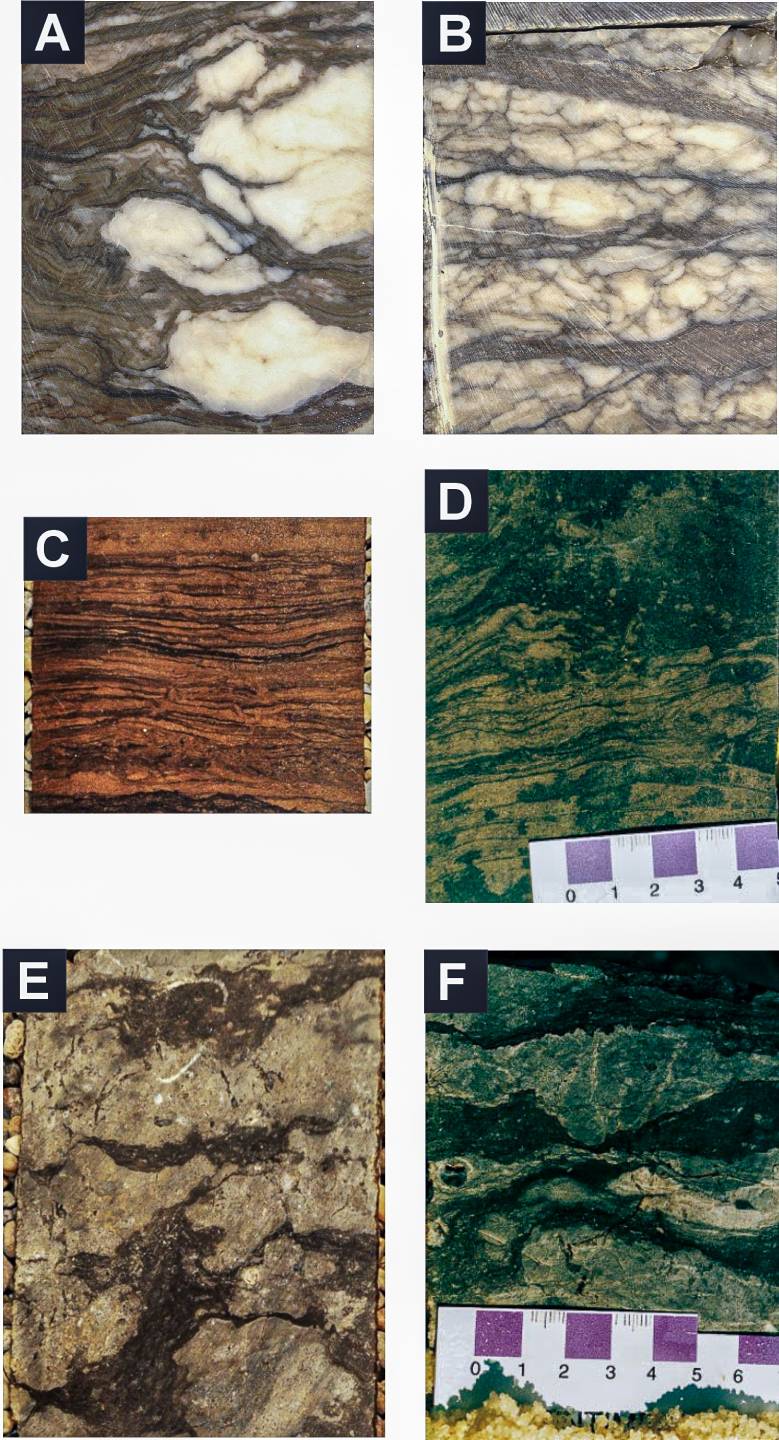
Figure 4. Example of core photographs illustrating lithofacies from the Red River A, B, and C interval: (A) white anhydrite nodules in wavy laminated dolomudstone. (B) layered nodular anhydrite with chicken-wire texture. (C) laminated dolomite. (D) laminated dolomite with heavy oil stain. (E) burrowed limestone. (F) burrowed-mottled limestone with skeletal debris. Modified from Husinec (2016): A, B; Nesheim (2017): C, E; Montgomery (1997): D, F.
Subsurface Energy Resources – Historical Context of Oil and Gas Activities
The Red River Formation is one of the biggest oil producers in the state. It's currently the third biggest productive formation behind the Bakken Formation and the Madison Group (Fig. 5).
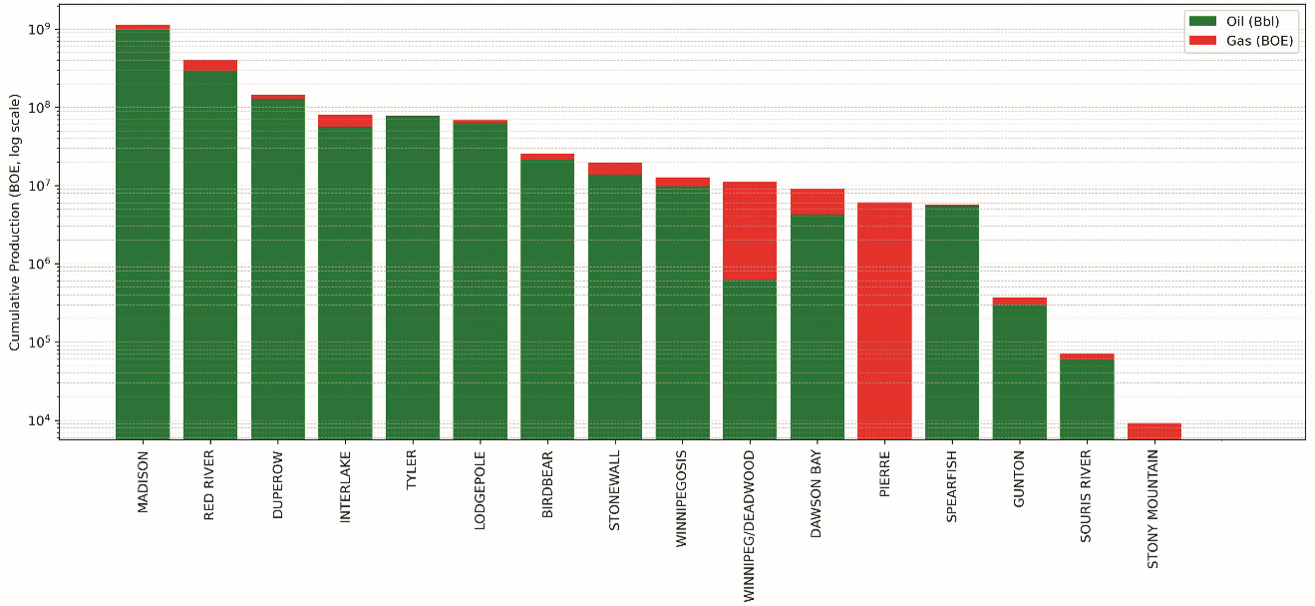
Figure 5. Cumulative oil and gas production by formation, excluding the Bakken-Three Forks Formations. Log scale in barrels of oil equivalent. Green for oil, red for gas. Note the Red River is trailing just behind the Madison Group (Faruqi, 2026).
Since its first discovery from the Cedar Creek anticline in the early 1950s, there have been over 1,400 Red River wells with production over 400 million barrels of oils within North Dakota (Nesheim, 2017; Faruqi, 2026).
By the Early Ordovician, from Member C – F, the region’ latitude had shifted, placing it in a tropical climate characterized by high rainfall and low evaporation (Ross, 1976). The siliciclastic and carbonate successions form asymmetrical vertical sequences that reflect the progradation of a siliciclastic shoreline and back-barrier environment over a shallow shelf and distal carbonate shoal.
Early exploration up until the 1980s, Red River exploration and production focused on major anticlinal structure (e.g., Cedar Creek anticline) in the southwestern margin of the Williston Basin targeting porous interval from laminated dolomite of B and C intervals which generally about 20 – 50 ft thick (Clement, 1985). The B interval has porosity ranging from 8% to 25% and permeability of 1 to 66 mD, whereas C interval averages 13% porosity and 0.9 mD permeability with intercrystalline, moldic-vuggy, and fracture porosity types (Clement, 1985; Montgomery, 1997; Sippel et al., 1998).
Later in the 1990s, with the development of horizontal drilling technology, the target evolved towards a stratigraphic play type, tracing the laterally extensive B interval. Despite its thin reservoir interval and low flow rates, the B interval became an attractive horizontal drilling target due to its laterally continuous high-permeability, oil-saturated upper portion, which could be efficiently drained by maintaining wellbore position within that sweet spot over a significant lateral distance (Montgomery, 1997). Unlike the structural play type where seismic data is the primary tool, this play type relies more heavily on well log and understanding the permeability distribution pattern (Montgomery, 1997). One of the early examples from this technology application in the Red River Formation B interval, is the Larkin and Coates wells that were drilled in late 1994. They were located in the eastern part of Cedar Creek anticline and close to poor vertical well production targeting a similar interval. Both wells, which are targeting just an 8 ft of net pay from the upper part of the B interval, were estimated to have ultimate recovery of 230,000 barrels of oil per well on 320-ac spacing and 8% depletion (Montgomery, 1997). In under two years, each well has already produced more than 110,000 barrels and tracking closely toward the estimated number, outperforming the vertical well performance (Montgomery, 1997).
Alongside horizontal drilling, advances in seismic technology also played a significant role in unlocking value from known Red River reservoirs. In 1980s, it became clear that porous intervals bring changes in seismic waveform (Carrell, 1998). It shows that by using 3-D seismic, one can identify and delineate the spatial distribution of high-porosity zone in a carbonate reservoir (Carrell, 1997; Sippel et al., 1998; Pearson and Hart, 2004). This is particularly helpful for mapping the porous zone in the Red River D interval. The heterogeneous and sporadic nature of the interval makes lateral tracing challenging. This finding led to extensive seismic acquisition and expansion of activities closer to the central part of the basin towards Golden Valley County. By the 2010s, the 31 wells drilled using 3-D seismic which targets high-porosity zones resulted in 24 oil discoveries, collectively producing more than 2.5 MMBO with some still actively producing (Nesheim and Faruqi, 2026). This result showed that the exploration success rate increased significantly from ~20% during earlier D interval exploration in Golden Valley County using 2-D seismic to ~80% by using 3-D seismic (Nesheim and Faruqi, 2026). As of 2026, this type of exploration remains active, highlighted by the current discovery of Sentinel Butte Field in 2024 and ongoing southward expansion of drilling activity within Golden Valley County.
The hydrocarbon found in Red River Formation is believed to be sourced from series of thin, organic-rich carbonate mudstone beds refer to as kukersite containing abundant algal microfossil Gloeocapsomorpha Prisca. The kukersites are interbedded with the burrow-mottled dolomitic wacke-mudstone in the D interval (Stasiuk and Osadetz, 1990; Nesheim, 2017) (Fig. 6A, B). Studies have shown that many Red River production wells are found outside of its thermally mature area. It is suggested that hydrocarbon generated by Red River kukersite must have migrated laterally through the D interval (Nesheim, 2017). It is proposed that remaining oil resource to be recovered from the Red River Formation may exceed one billion barrels (Hill et al., 2018).
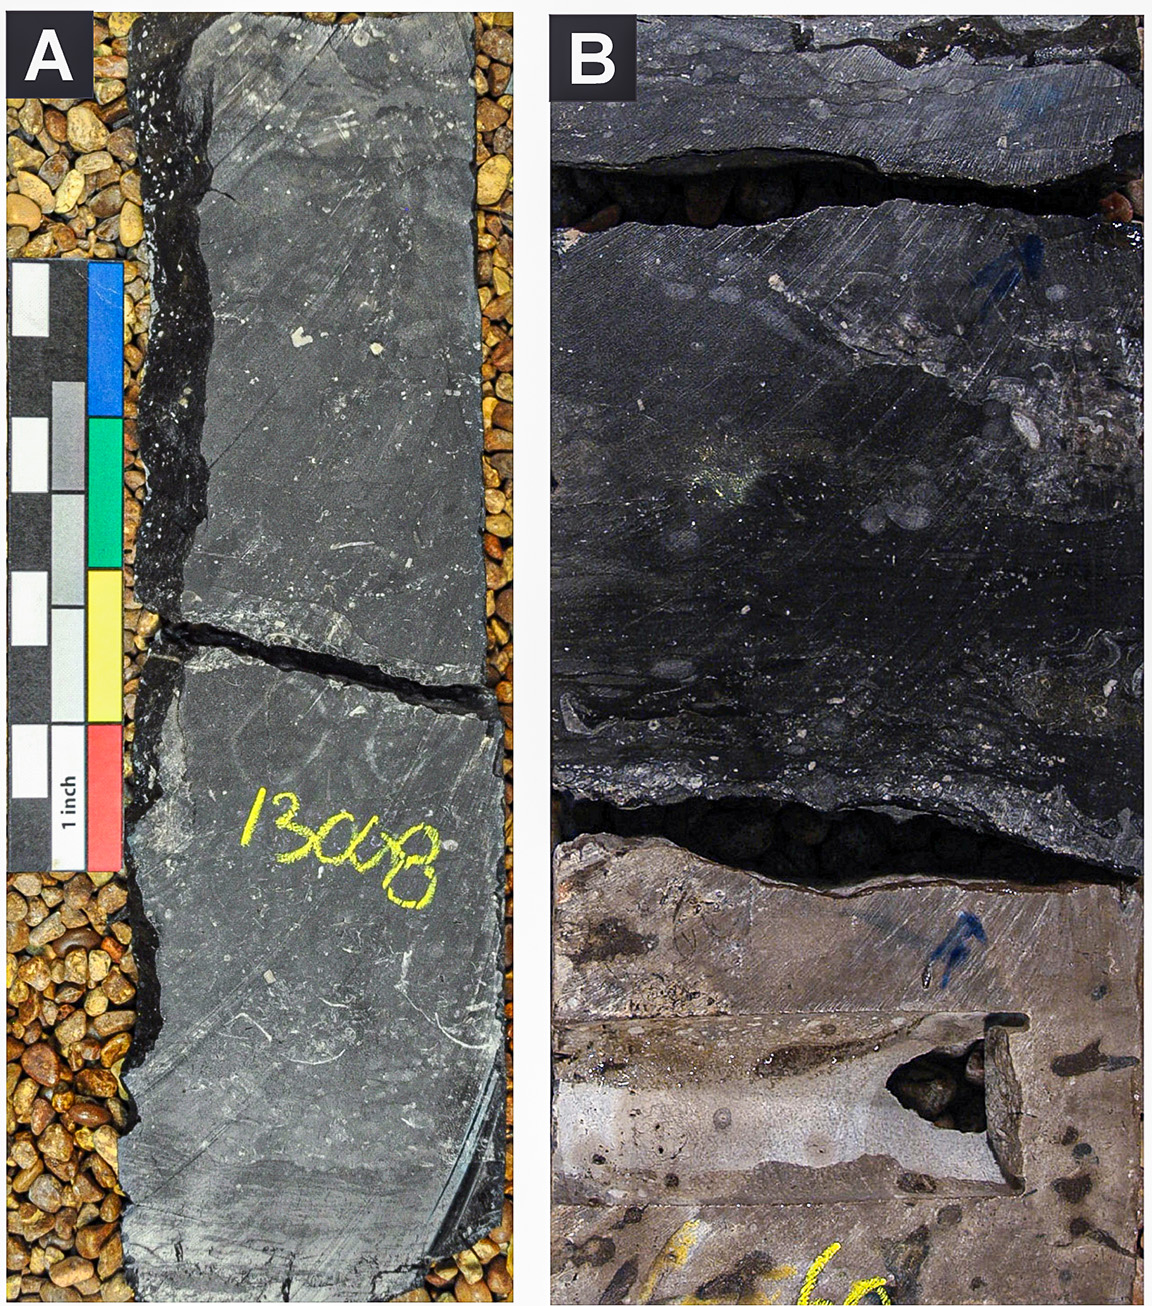
Figure 6. Example of core photographs from the Red River D interval: (A) Highly organic-rich K2 kukersite (from NDIC database), and (B) sharp contact between burrow-mottled lime mudstone (bottom) and dark grey to black organic rich skeletal mud-wackestone (modified from Husinec, 2016).
Ballard, F.V., 1963, Structural and stratigraphic relationships in the upper Paleozoic rocks of eastern North Dakota: North Dakota Geological Survey Bulletin 40, 42 p.
Blakey, R., 2013, North American paleogeographic maps: Paleogeography Library, Colorado Plateau Geosystems, Inc., https://deeptimemaps.com/
Carrell, L.A., 1998, Improved recovery demonstration for Williston Basin carbonates: Quarterly technical progress report, October-December 1997: U.S. Department of Energy, Cooperative Agreement DE-FC22-94BC14984-19, 1 p.
Carroll, W.K., 1979, Depositional environments and paragenetic porosity controls, Upper Red River Formation, North Dakota: North Dakota Geological Survey Report of Investigation 66, 51 p.
Clement, J.H., 1986, Cedar Creek: A significant paleotectonic feature of the Williston Basin, in Peterson, J.A., ed., Paleotectonics and sedimentation in the Rocky Mountain region, United States: AAPG Memoir 41, p. 213-240.
Faruqi, I.H., 2026, Looking beyond giants: A brief creaming curve perspective for post-Bakken/Three Forks exploration in the Williston Basin, North Dakota: North Dakota Geological Survey Geo News, January 2026, p. 10.
Fuller, J.G.C.M., 1961, Ordovician and contiguous formations in North Dakota: AAPG Bulletin, v. 45, p. 1334-1363.
Hill, R.B., Harman, C., and Ross, J.G., 2018, A detailed study of the Red River Formation (C & D Members) in the U.S.A. portion of the Williston Basin: AAPG Search and Discovery Article 90323.
Husinec, A., 2016, Sequence stratigraphy of the Red River Formation, Williston Basin, USA: Stratigraphic signature of the Ordovician Katian greenhouse to icehouse transition: Marine and Petroleum Geology, v. 77, p. 487-506.
Kendall, A.C., 1976, The Ordovician carbonate succession (Bighorn Group) of southeastern Saskatchewan: Saskatchewan Geological Survey Report 180, 186 p.
Montgomery, S.L., 1997, Ordovician Red River "B": Horizontal oil play in the southern Williston Basin: AAPG Bulletin, v. 81, no. 4, p. 519-532.
Murphy, E. C., S. H. Nordeng, B. J. Juenker, and J. W. Hoganson, 2009, Stratigraphic column of North Dakota: Bismarck, North Dakota, North Dakota Geological Survey Miscellaneous Series 91, 1 p.
Nesheim, T.O., 2017, Stratigraphic and geochemical investigation of kukersites (petroleum source beds) within the Ordovician Red River Formation, Williston Basin: AAPG Bulletin, v. 101, p. 1445-1471.
Nesheim, T.O., and Faruqi, I.H., 2026, Renewed exploration in the Red River Formation in southwestern North Dakota using 3-D seismic: North Dakota Geological Survey Report of Investigation 138. 26 p.
Paterson, D.F., 1971, The stratigraphy of the Winnipeg Formation (Ordovician) of Saskatchewan: Saskatchewan Department of Mineral Resources Report 140, 57 p.
Pearson, R.A., and Hart, B.S., 2004, Three-dimensional seismic attributes help define controls on reservoir development: Case study from the Red River Formation, Williston Basin, in Eberli, G.P., Masaferro, J.L., and Sarg, J.F., eds., Seismic imaging of carbonate reservoirs and systems: AAPG Memoir 81, p. 43-57, doi:10.1306/M81928C2.
Porter, J.W., and Fuller, J.G.C.M., 1959, Lower Paleozoic rocks of northern Williston Basin and adjacent areas: AAPG Bulletin, v. 43, p. 124-189.
Sinclair, G.W., 1959, Succession of Ordovician rocks in southern Manitoba: Geological Survey of Canada Paper 59-5, 9 p.
Sippel, M., Luff, K.D., Hendricks, M.L., and Eby, D.E., 1998, Reservoir characterization of the Ordovician Red River Formation in southwestern Williston Basin, Bowman County, North Dakota, and Harding County, South Dakota: U.S. Department of Energy Report DE98000487, 148 p.
Stasiuk, L.D., and Osadetz, K.G., 1990, The life cycle and phyletic affinity of Gloeocapsomorpha prisca Zalessky 1917 from Ordovician rocks in the Canadian Williston Basin, in Current Research, Part D: Geological Survey of Canada Paper 89-1D, p. 123-137.