[ ]
]
[]

|
People often wonder how thick the glacial ice was that covered North Dakota. When asked, my response has usually been "I don't know," but sometimes I've speculated if the questioner has persisted.
My answer is usually something like "The ice may have been as much as a mile thick in the northeastern corner of North Dakota at Pembina, which is where I think it was the thickest in North Dakota," or
"It was up to 8,000 feet thick near Hudson Bay." But I've never done any kind of study myself to verify whether my estimate for North Dakota was even close to being correct. This "Geologic Note" will deal with the question of the thickness of the glacial ice and with isostatic depression and rebound of the earth's crust due to the effects of glaciation, especially in eastern North Dakota. There would seem to be a number of ways to get at the answer to the question "how thick was the glacier?" We can make comparisons with existing glaciers in places like Greenland and Antarctica, but these may or may not be typical of the glaciers that covered North Dakota 20,000 years ago, near the maximum of the most recent glaciation, the Late Wisconsinan glaciation. Another way of indirectly getting at the answer of how much ice existed during the Ice Age is to determine the amount that sea level dropped at the time - the amount of the drop must represent the water that was tied up as glacial ice during the Ice Age. A more direct way to get at the problem locally is to study the glacial geology of North Dakota and nearby areas. We know that the most recent glacier that covered eastern North Dakota extended about as far south as Des Moines, Iowa. Assuming the glacier ice thinned southward to its edge in Iowa, and because we do know the characteristics of modern glaciers and how they are structured, we can speculate how thick the ice was in North Dakota. Drawing a simple profile of the glacier from Des Moines northward through the Red River Valley and on to the main center of accumulation near Hudson Bay, we might be able to get a rough idea of how thick the ice must have been to have flowed that far south. That's assuming, of course, that we know the kind of profile the Late Wisconsinan glaciers had. But it's not nearly that simple. We know that the weight of the glacier ice was so great that it depressed the crust of the earth. The earth's crust behaves as an elastic structure and glaciologists know that, once the ice reaches a certain thickness, it depresses the crust about a foot for every three feet of ice (ice is roughly one third as dense as crustal rock). Normally, this deformation takes the form of gentle flexing and unflexing of the earth's crust, although it can be accompanied by faulting and reactivation of large regional structures. Thus, when the glacier melts, the crust returns (rebounds) to the position it had been before the ice advanced over it. It may do this smoothly and gradually, or the rebound may happen in quick jumps, resulting in earthquakes as faults form. I've seen quite fresh appearing 20-meter-high fault scarps in Lapland, where deglaciation occurred relatively recently and rapid rebound is currently taking place, spasmodically, as earthquakes. The greatest measured rates of isostatic or postglacial rebound in North America occur in the Richmond Gulf area of southeastern Hudson Bay (presumably where the ice was thickest). There, a kind of "staircase" of 185 Holocene (postglacial) strandlines (former shorelines) provide a continuous record of emergence from about 8,000 years ago until the present. At least 935 feet of recovery (isostatic rebound) has been recorded by these strandlines. By determining the age of these strand lines, and by subtracting the apparent component of uplift due to relative sea level fluctuations, geologists have been able to measure rates of isostatic rebound. The rates of uplift have declined from a maximum of 33 to 39 feet per 100 years immediately following deglaciation (8,000 years ago at Hudson Bay - in North Dakota deglaciation occurred about 5,000 years earlier) to a current rate of about 4.3 feet/100 years. In other words, the shoreline at Churchill, Manitoba on the shore of Hudson Bay is currently rising about 4.3 feet per century. In 1994, a University of North Dakota geology student tackled the problem. Eric Brevik wrote his master's thesis on the topic "Isostatic Rebound in the Lake Agassiz Basin Since the Late Wisconsinan." His study addressed three main questions: 1) how thick was the ice that covered the Lake Agassiz basin in eastern North Dakota, and how much did the ice depress the earth's crust, 2) how much rebound has occurred since deglaciation and is that rebound complete, and 3) what were the effects of this rebound on the lake basin? By considering some of these questions, Brevik attempted to calculate the amounts of isostatic rebound during and following deglaciation. He then used his results to estimate total maximum ice thickness. I do not include his mathematics in this essay nor all the reasoning he presented in his thesis, which is over 100 pages long. Rather, I'll simply repeat some of his conclusions and then make some comments of my own. To calculate the glacier thickness in North Dakota, Brevik needed to know how much the crust was depressed - and this was best done by determining how much it has rebounded from the amount it had been depressed, when the ice was thickest. Fortunately, there is a way to estimate this, at least in eastern North Dakota in the Lake Agassiz basin: by studying the tilted strandlines left by glacial Lake Agassiz. Glacial Lake Agassiz formed several strandlines, each representing a level the lake occupied for a time. Each strandline is marked in some places by a wave-cut scarp, in other places by a beach that was deposited at the shore of the lake. In some places the strandlines cannot be identified, either because no recognizable feature formed or because post-glacial erosion or other changes have obliterated them. The oldest and highest continuous strandline is the Herman (named for the town of Herman, Minnesota), where a Lake Agassiz beach is well developed. The Herman strandline, or beach, rebounded more in the north, at the Canadian border than it did in the south at the South Dakota border because the ice was thicker in the north. This explains why the strandlines are tilted. One problem with quantifying the amount of uplift is that much of the rebound took place while the ice was thinning so that much of the rebound had already taken place by the time glacial Lake Agassiz started to form at the south end of the melting glacier. It's been estimated that three-quarters of the total rebound occurs while the glacier is still thinning, before it has disappeared. The Herman strandline is 54.5 meters (179 feet) higher at the Canadian border than at the South Dakota border. That figure is an absolute minimum amount of rebound. In fact, it represents only the amount of rebound that took place after most (perhaps 3/4) of the rebound had already occurred. Furthermore, it's also necessary to consider the weight of the water in the lake and the weight of the lake sediments that were deposited in Lake Agassiz; these must have kept the crust from rebounding to its preglacial elevation. Brevik calculated that, at Grand Forks, the lake was as much as 100 meters (330 feet) deep and that the average thickness of lake sediments there is as much as 46 meters (150 feet). These masses would cause crustal depression of 38 meters (125 feet) and 40 meters (130 feet), respectively. The sediments are still in place in the Lake Agassiz Basin, causing 40 meters of depression that was not compensated by rebound. Brevik concluded that the tilt of the Herman strandline, when combined with the effects of the Lake Agassiz sediments, represents crustal depression of between 95 and 350 meters, figures which correspond to ice-thickness values of 280 to 1,040 meters, respectively. He therefore concluded that the actual ice thickness along the North Dakota-Minnesota border must have been somewhere between the two extremes that he calculated. In another study of glacial rebound, done in Canada, Peltier (1994) concluded that the continental ice sheet over southern Manitoba reached a thickness as thick at 1.5 km (0.9 miles thick). This ice buildup was associated with an estimated 200 meters of isostatic depression of the earth's crust in that area (Dyke and Prest, 1986). These figures are close to my own earlier estimates. So, how thick was the glacier in North Dakota? Brevik concluded that it was probably somewhere between 280 and 1,040 meters thick (between 920 feet and 3,410 feet thick). That's a considerable range and also somewhat shy of my estimate at the beginning of this article (I said I thought it was up to a mile thick). I accept the results of Eric Brevik's study, although I caution that it includes a lot of assumptions and estimates of things no longer really measurable. It would appear that I should lower my own estimate, although I still think the actual answer may be closer to Brevik's higher estimate than his lower one. Since the center of glacier ice accumulation was in the Hudson Bay area, we presume that the thickest ice was in that area. We can't be sure though, where the thickest glacial ice was in North Dakota, although it's likely it was in the northeastern part of the state. The most-recent glacier, the Late Wisconsinan glacier, covered all of the eastern and northern parts of the state between about 25,000 and 20,000 years ago. The edge of the Late Wisconsinan glacial deposits is well defined and coincides with the edge of the glacier. The ice at the edge of the glacier was thin, the ice presumably thinning to nothing along its margin. The glacier tended to flow most easily through the lower areas - such as the Red River Valley - and it tended to fill the higher areas more slowly. Since elevations in North Dakota rise to the west and southwest, it is likely that the glacier ice in those areas was thinner. Geologists working for the North Dakota Geological Survey have identified glacial deposits in the southwestern part of the state that are well beyond the Late Wisconsinan ice marginal limit. These consist of patches of much-older glacial sediment or, in places, areas of sporadic erratic boulders. Assuming that the earlier glaciers followed flow patterns similar to those followed by the Late Wisconsinan glacier (and that assumption cannot be proven), then it is likely that at least some of the earlier glaciers must have been thicker near their centers than were the more-recent ones. That is, in order to extend onto the higher elevations of southwestern North Dakota, a larger volume of glacial ice would have been required. Evidence for Glacial Rebound in the Red River ValleyThe most common, but indirect, evidence for glacial rebound in North Dakota is the strandlines that formed along the shore of glacial Lake Agassiz. These are mainly beach ridges and they are easily seen from the air due to their topographic expression and vegetation changes (see the NDGS Note dealing with glacial Lake Agassiz). 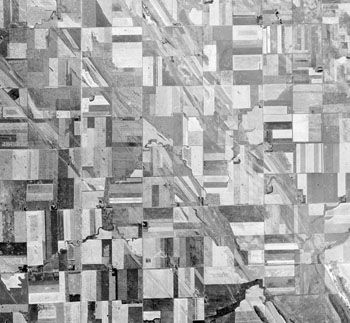 Vertical air photo of beach ridges of glacial Lake Agassiz in south-central Grand Forks County about five miles south of Emerado. The area shown is six miles wide. Starting at the left of the area are the closely spaced Campbell and McCauleyville beaches, the three closely spaced Blanchard beaches, the Hillsboro Beach and, in the upper right corner, the Emerado Beach. North is to the top of the photo. Although the beaches are normally readily visible from the air, tracing all but the best-developed beaches across the countryside can be difficult. Changes in beach morphology, gaps, the often-blurred distinction between beaches and offshore bars, elevation changes due to postglacial rebound, and depositon over stagnant ice and subsequent collapse combine to make correlation of beaches difficult. In addition, as they are traced northward, the highest-level beaches consist of multiple segments rather than single, well-developed ridges. Despite the difficulty in correlating them, the former shorelines of glacial Lake Agassiz have been named and traced for hundreds of miles. In the southern part of the Lake Agassiz Basin, about 55 sets of strandlines have been recognized. Table 1 lists the principle beaches. Notice how the elevations of the beaches rise to the north and how the younger beaches rise less (analyses of strandlines in Minnesota and Ontario show that strandlines rise in elevation to the east as well, indicating that the glacial ice was thicker - and rebound was greater - to the east of the Red River Valley). The younger, lower beaches rise less because of the exponential decrease in the rate of rebound over time; when the lower beaches formed, later, much of the rebound had already taken place. 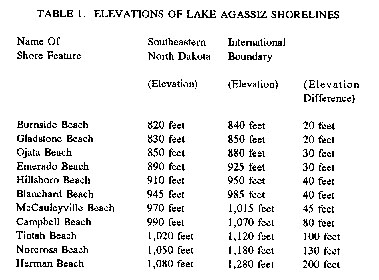 Elevations of selected Lake Agassiz shorelines. The older, higher level shorelines rise the most because when they formed much of the Lake Agassiz basin was still glaciated (and thus isostatically depressed). The younger, lower beaches do not rise as much because by the time they had formed much of the rebound had already taken place. Modified from Bluemle (2000). The decreasing gradient has also caused tributary rivers to the Red River to shift their courses as alternate steeper routes became available. The Red Lake River, for example, used to enter the Red River from Minnesota at a point about 20 miles downstr26-Jul-2007 gradient became so low that the Red Lake River could no longer maintain its route, the river broke away from its established channel and followed a new, steeper route that took it to Grand Forks. After the Red Lake River established its route to Grand Forks, the increased volume of water delivered to the Red River there exceeded the capacity of the channel downstream. As a result, the meanders of the Red River were washed out and the channel straightened north of Grand Forks, downstream to the point at which the Red Lake River and Red River had originally joined. 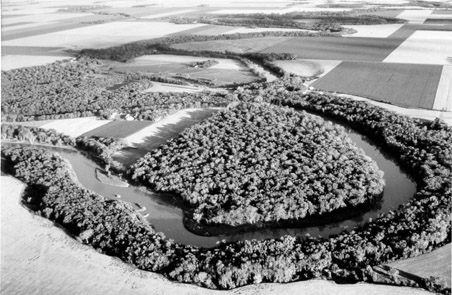 Typical meander on the Red River. 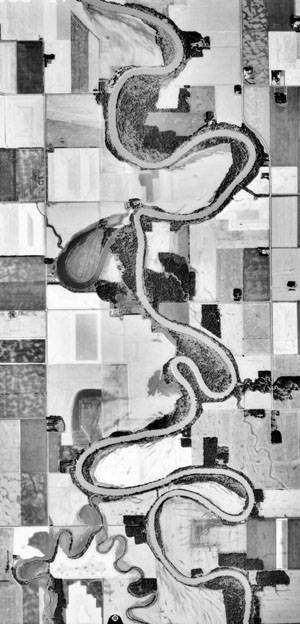 Meandering Red River of the North about four miles south of Drayton (Walsh County, North Dakota on the left, Marshall County, Minnesota on the right). Due to the low northerly gradient on the Red River, and the fact that, as a result of isostatic rebound, the gradient continued to become more gentle long after the route of the river was established, the river meanders over a broad flood plain. Old meander scars and oxbox lakes are common along the river. Meander scars are portions of the former river channel, now abandoned; oxbox lakes occur in the meander scars. A meander scar with an oxbow lake can be seen near the top of the photo, on the North Dakota side of the river. The Park River can be seen entering the Red River in the lower left corner of the air photo. 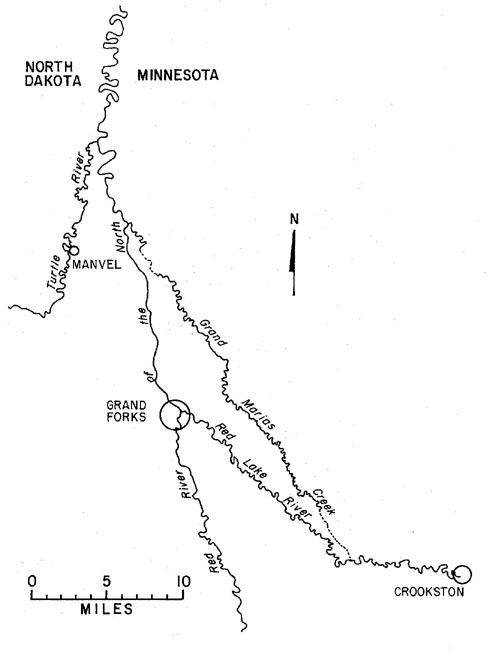 Evidence of isostatic rebound in the valley of the Red River of the North. The routes of the rivers shown on the map (left) reflect the fact that isostatic rebound was greater in the north than in the south because the ice was thicker and heavier in the north. Rebound continued, although at a decreasing rate, for some time after the last ice melted in North Dakota and Minnesota. As a result, the gradients along the northerly flowing rivers became increasingly gentle as the land to the north rose more than did the land in the south. As their gradients decreased, the rivers meandered over ever broader floodplains. Eventually, when the gradient became so low a river could no longer maintain its route, the river broke away from its established channel and followed a new route over a steeper gradient. A good example of the effect of isostatic rebound is the way it affected the route of the Red Lake River in northwestern Minnesota in the Grand Forks-Crookston area. The Red Lake River once entered the Red River at a point three miles northeast of Manvel, North Dakota. When its gradient became too gentle because of rebound, the Red Lake River established a new route, following a steeper gradient that took it to Grand Forks. The old channel of the Red Lake River is now occupied by a small stream, Grand Marais Creek. After the Red Lake River established its route to Grand Forks, the increased volume of water delivered to the Red River there exceeded the capacity of the channel of the Red River. As a result, the meanders on the Red River were washed out and the Red River straightened its channel north of Grand Forks, downstream to the point at which the Red Lake River and Red River had originally joined. ReferencesBluemle, J. P., 2000, The Face of North Dakota, 3 rd Edition: North Dakota Geological Survey Educational Series 26, p. 70 - 75. Brevik, E. C., 1994, Isostatic rebound in the Lake Agassiz Basin since the late Wisconsinan: MS Thesis, University of North Dakota, 127 p. Brevik, E. C. and Reid, J. R., 1994, Ice-thickness in the Lake Agassiz Basin during the Wisconsinan: Proceedings of the North Dakota Academy of Science, v. 48, p. 80. Dyke, A. S., Morris, T. F., and Green, D. E. C., 1991, Postglacial and tectonic and sea level history of the central Canadian Arctic: Geological Survey of Canada, Bulletin 397, 56 p. Dyke, A. S. and Prest, V. K., 1986, Late Wisconsinan and Holocene retreat of the Laurentide ice sheet: in Fulton, R. J., ed., Quaternary geology of Canada and Greenland: Boulder, Colorado, Geological Society of America, Geology of North America, v. K-1 map 170-2 A, scale 1: 500,000. Hillaire-Marcel, Claude, and Fairbridge, R. W., 1978, Isostasy and Eustasy of Hudson Bay: Geology, v. 6, p. 117 - 122. Peltier, W., 1994, Ice age paleotopography: Science, v. 265, p. 195 - 201. |